
You may all be familiar with top or htop that lets you monitor how your server is doing. Let’s talk today about how you can monitor network activity in a similar fashion. All tools referenced here are command line tools. There are more detailed applications (with front end web interfaces), but we will defer them for a later post as they need more details on installation & activation.
This is a simple “top” equivalent for network usage. It lists the in & out traffic usage by process. Installation is from the default linux package managers (apt-get/yum)
# apt-get install nethogs         # Ubuntu/Debian

# yum install nethogs             # CentOS/RHEL
You can run it as
# nethogs

NetHogs version 0.8.5-2


PID USER      PROGRAM               DEV     SENT    RECEIVED       RECEIVED

603 root       sshd: root@pts/0    enp4s0   0.705   0.350 KB/sec   0.253 KB/sec

17408 root    httrack              enp4s0   0.431   0.197 KB/sec   0.193 KB/sec

? root      unknown TCP                     0.000   0.000 KB/sec   0.000 KB/sec

TOTAL                                       1.136   0.547 KB/sec   0.461 KB/sec
By default the output shows the incoming & outgoing traffic in KB/sec. If you are looking to see an accumulated total of data throughput, press the letter M to cycle between the number of bytes, kilobytes and megabytes sent and received.
Nethogs works best to identify processes that are suddenly using a lot of your bandwidth.
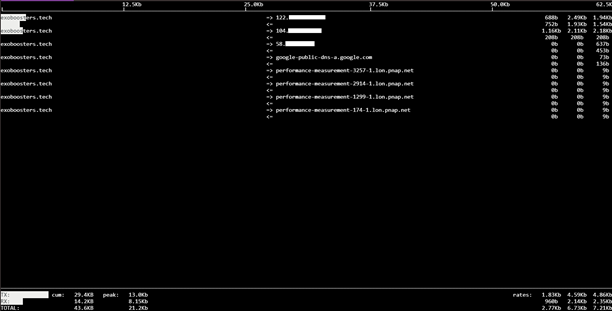
iftop is another “top” equivalent for sysadmins that gives you live statistics about what network connections use the most bandwidth. iftop automatically refreshes every few seconds automatically sorting the connections by usage.
iftop has two dependencies that need to be installed first – libpcap and libncurses. iftop is part of the epel-repository and needs to be enabled before you can yum install. Installing on Ubuntu is achieved by a direct apt install
Ubuntu
# apt-get install libpcap0.8 libpcap0.8-dev libncurses5 libncurses5-dev

# apt-get install iftop
CentOS/RHEL
# yum install libpcap libpcap-devel ncurses ncurses-devel

# yum install epel-release

# yum install iftop

By default iftop attempts to lookup IP addresses and get the corresponding hostnames. This could take up time and slow down the program, you can bypass this by passing the -n argument when running iftop
Nload is another command line network throughput monitor that shows input and output as graphs that update in realtime. You also get information of the total transferred data and the min/max network usage
To install,
# apt-get install nload      # Ubuntu/Debian

# yum install epel-release   # CentOS/RHEL

# yum install nload          # CentOS/RHEL
You can run nload to monitor a particular network device or all network connections.
The default refresh rate is 100 milliseconds, which can be overridden using the -t parameter.
# nload -t 500 # sets refresh rate to 500 milliseconds
bmon or Bandwidth monitoring is another useful network bandwidth analyzer that shows information in useful graphical format. It provides network related statistics presented in a human friendly way.
bmon allows you to choose the way the output is generated, HTML, ASCII output, graphs or interactive curses user interface. bmon also shows traffic across all network interfaces
In most distributions, bmon installation is a single line command like this
# apt-get install bmon # Ubuntu/Debian
However, for CentOS 7, there are no available packages and must be installed manually.
# wget https://github.com/martinh/libconfuse/releases/download/v3.2.2/
confuse-3.2.2.zip

# unzip confuse-3.2.2.zip && cd confuse-3.2.2

# sudo PATH=/usr/local/opt/gettext/bin:$PATH ./configure

# make

# sudo make install
This installs libconfuse which is required for bmon. Next we install bmon as below
# git clone https://github.com/tgraf/bmon.git && cd bmon

# ./autogen.sh

# ./configure

# make

# sudo make install
Once installed, bmon can be invoked directly as a line command

bmon shows information about all the interfaces with information about the received and transferred bytes. It also shows a graph of the usage. Data is refreshed every second. If you don’t want graphs and prefer something similar to nethogs, you can invoke bmon with the -o ascii option
# bmon -o ascii
Finally to get the output as a HTML file, you can pass html as the option for -o parameter and route the output to a path that is accessible to a webserver
# bmon -o html:path=/var/www/html/bmon
The last tool we will see today is another full fledged network monitor that can be launched from the command line. vnstat does not sniff any traffic, but uses the network interface statistics provided by the kernel. This ensures light use of the system resources. vnstati is used to provide the graphical display of statistics.
These statistics are stored across reboots so you can see historical information. vnstat also generates output graphs as images which can be displayed through a webserver.

The color codes in the image are configurable so you can choose the combination that matches your brand. There is a handy online color editor at https://humdi.net/vnstat/coloredit/ to help you.
To install vnstat on Ubuntu/Debian, use the apt package manager
# apt-get install vnstat

# apt-get install vnstati
On CentOS, we have to install it from the source, the steps are
# wget https://humdi.net/vnstat/vnstat-2.1.tar.gz

# tar -xvf vnstat-2.1.tar.gz

# cd vnstat-2.1.tar.gz

# make
Once compilation is successful, issue
# make install
Finally, create an empty directory /var/lib/vnstat where historical information of the network is stored, i.e. our database resides here. Each network interface will be stored as a file under this directory (This step is not required for Ubuntu/Debian)
# mkdir /var/lib/vnstat
To start monitoring, you will need to activate vnstat for the interface you choose.
# ifconfig -a
returns the list of interfaces
# vnstat -u -i venet0 # to start monitoring interface venet0
Wait a while for data to be captured and then enter vnstat. You will be able to see the details of the received and sent transactions.

By passing options such as -h/-w/-m you can view statistics by Hour, Week or Month respectively.
To get the beautiful images that can be served by a webserver, run vnstati. You must also specify the output directory where the image is stored (.png output)
# vnstati -s -i venet0 -o /var/www/html/vnstat/summary.png
The -s option indicates summary and -i specifies the interface whose information we need
To view hourly statistics as an image, use the -h parameter
# vnstati -h -i venet0 -o /var/www/html/vnstat/hourly.png
As you can see it is easy to put this in a cron job and have the values refreshed directly to be picked up by a webpage.
There are many other useful command line tools such as cbm, iptraf which helps you monitor network usage. Whatever the tool you use, it is important to keep track of the network consumption to identify any processes that are consuming high bandwidth and finally ensuring that you don’t run into overages at the end of your billing cycle.

